
Dashboard
The protected / route is the Dashboard page. It summarizes jobs, active
runs, success rate, failed runs, rows processed, average duration, and queue
latency for a selected time window.
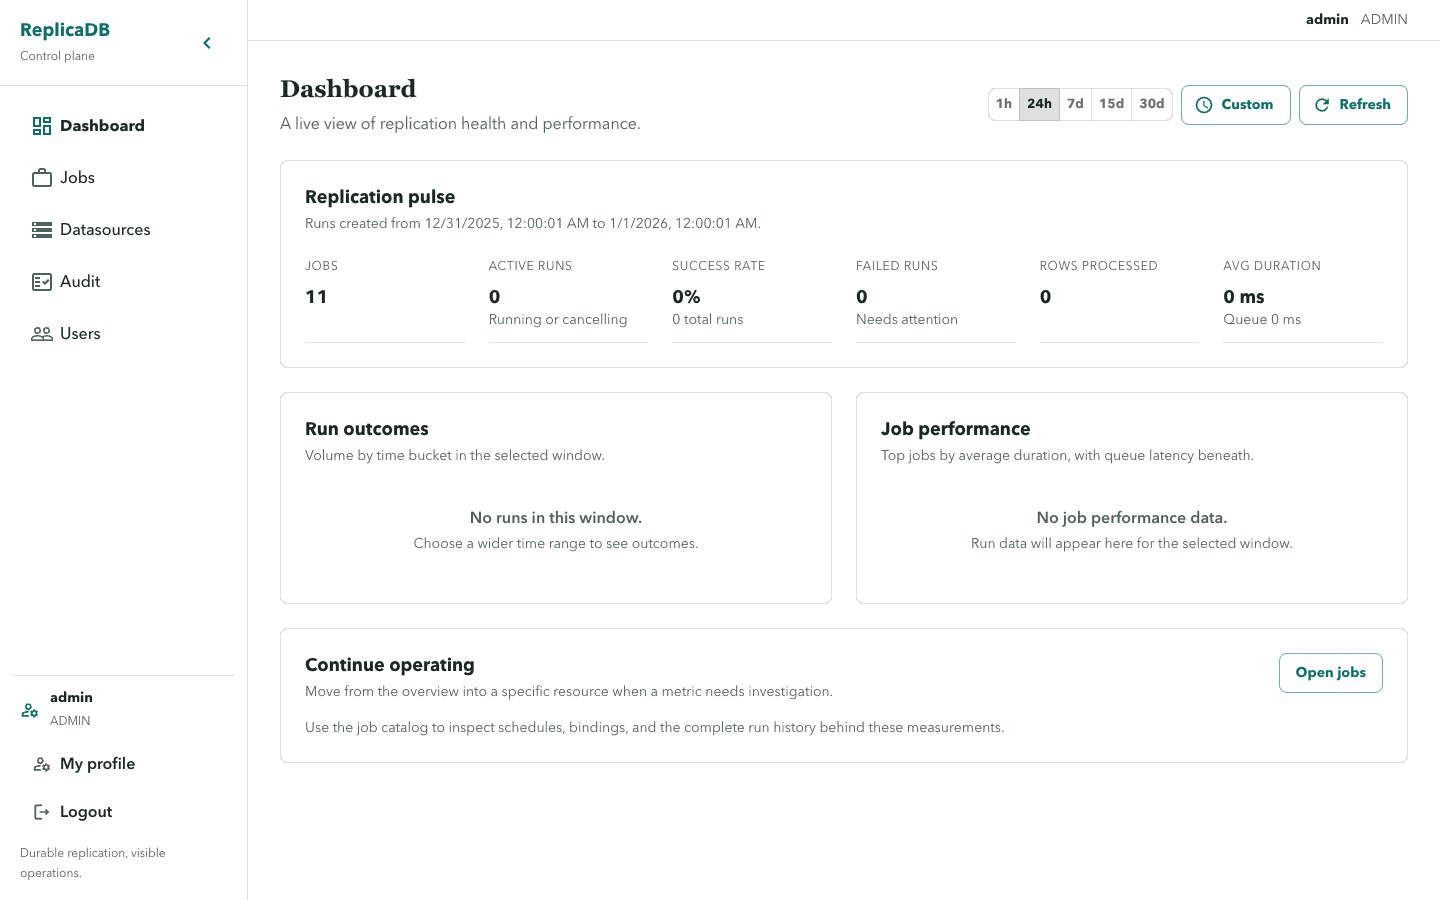
Use the time-window controls or Custom time range, then choose Apply range.
Refresh refetches the summary. A run chart separates Succeeded, Failed,
and Active; duration and queue latency are shown as separate series.
Investigate from a summary
Section titled “Investigate from a summary”Use a time window that includes the suspected run, then compare active work,
failure count, queue latency, and duration before changing a job. Open jobs
leads to the definitions behind the aggregate; a job detail then exposes its
bindings, schedule, and run history. Open a specific run to inspect its
attempt, timestamps, warnings, and bounded diagnostics.
The dashboard is an aggregate over jobs visible to the current user. It is not a source of execution ownership or a substitute for job-level permissions. A missing metric may mean an empty window, a restricted job, or a failed load; check the visible state before assuming that work did not run.
Validate and recover
Section titled “Validate and recover”The dashboard is an overview, not an authorization boundary. Use Open jobs
to inspect the job definition, schedule, bindings, and run history behind a
metric. Empty windows show No runs in this window. and suggest choosing a
wider range; load failures show an error with Try again. For persistent queue
or readiness symptoms, use health and metrics
and troubleshooting before retrying
or scaling work.